

The total price of a DTF gang sheet does not tell you everything about the economics of the order. A more useful question is how many transfers you can actually use for the amount you are spending. A sheet with a higher total price can still produce a lower average cost per usable transfer if it gives you meaningfully more production-ready transfers.
The basic calculation is simple: cost per usable transfer = comparable order cost ÷ usable transfer count. The challenge is defining those two inputs consistently. You need to decide what cost you are comparing, identify which transfers are genuinely useful to your production plan, and recalculate whenever the quantity or artwork mix changes.
This guide focuses specifically on the unit economics of one gang sheet order. If you are trying to understand transfer pricing more broadly, the DTF transfer pricing guide covers the wider pricing topic. If you are already comparing gang sheet ordering options, you can also review the DTF Gang Sheet collection.
Start With the Usable Transfer Count
Not every graphic visible on a gang sheet should automatically count as a usable transfer in your cost calculation. The denominator should represent transfers you actually expect to use in production.
Suppose a hypothetical sheet contains 52 graphics. If four of those are outdated versions, accidental duplicates, or transfers you no longer expect to use, counting all 52 would make the average cost per transfer look lower than the practical result. For your own production economics, using 48 as the usable transfer count would give you a more realistic comparison.
This distinction becomes especially important when a sheet contains several artwork versions, mixed sizes, repeated logos, seasonal graphics, or quantities that were added simply because space remained. The question is not just, “How many graphics are on the sheet?” It is, “How many usable transfers am I actually getting from this order?”
Use a Consistent Cost-Per-Transfer Formula
The simplest formula is:
Effective cost per usable transfer = total comparable cost ÷ usable transfer count
The word comparable matters. If you compare two order scenarios, use the same cost basis for both. If you are comparing product subtotals, use product subtotals in both calculations. If you are evaluating a broader order total, use the same type of total for both scenarios.
Mixing different cost definitions creates a misleading result. For example, comparing the product subtotal of one order with a broader total from another order would not tell you which scenario has the better unit economics.
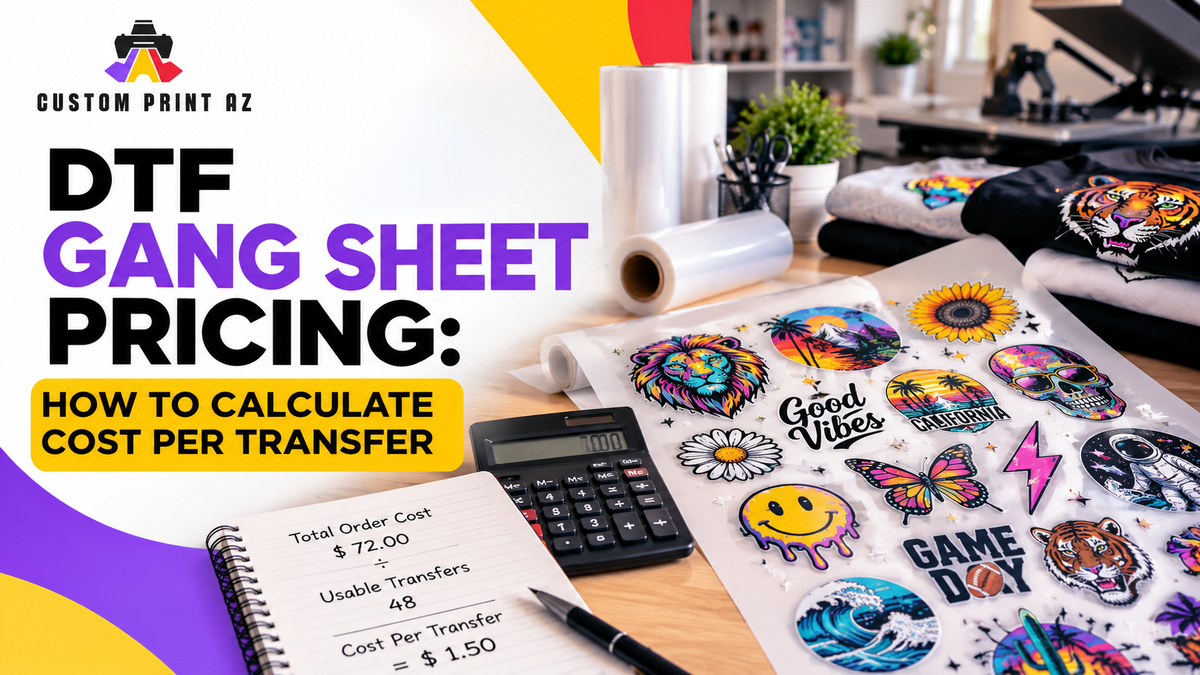
Hypothetical calculation: assume the comparable cost of an order is $72 and the order produces 48 usable transfers.
$72 ÷ 48 = $1.50 average cost per usable transfer.
This is only a hypothetical calculation used to demonstrate the method. It is not a Custom Print AZ price, quote, discount, or pricing promise.
Compare the Same Unit Metric, Not Just the Total Price
Two gang sheet orders can look very different when you compare their total prices and then look similar—or reverse positions—when you calculate the usable cost per transfer.
Consider two hypothetical scenarios:
Scenario A: the comparable order cost is $72 and the usable transfer count is 48. The average cost per usable transfer is $1.50.
Scenario B: the comparable order cost is $84 and the usable transfer count is 70. The average cost per usable transfer is $1.20.
Scenario B costs more overall, but it produces a lower average cost per usable transfer. That does not automatically make it the better purchase. It simply gives you another metric for evaluating the order.
The better decision question is not always, “Which gang sheet costs less?” It may be, “Which order gives me a more useful cost per transfer for the quantity I will actually consume?”
This distinction matters when comparing different sheet sizes, quantities, or artwork combinations. Buying more solely to make the calculated unit cost look lower can create a false sense of savings if you do not expect to use the additional transfers.
What Blended Cost Means When Transfer Sizes Are Mixed
A single gang sheet may contain small chest logos, sleeve graphics, medium designs, and larger back prints. If you divide the total comparable cost by the total usable transfer count, the result is a blended cost per transfer.
For example, imagine a hypothetical order with a comparable cost of $90. It contains 30 small usable transfers and 15 larger usable transfers, for a total usable count of 45.
$90 ÷ 45 = $2.00 blended cost per usable transfer.
This number is useful as an order-level average. It helps you compare the overall economics of one mixed-size gang sheet with another order scenario.
But it does not mean that every small logo and every large transfer individually costs exactly $2.00. Different transfer sizes do not necessarily represent the same amount of sheet area or the same share of the overall order.
That distinction is important. A blended unit cost is best treated as an average for the order, not as proof of the true individual cost of every design on the sheet.
When Does Design-Level Cost Matter?
If you need to evaluate separate design groups individually, the blended average may no longer be enough. You would need a consistent method for allocating part of the shared sheet cost to each design group.
There is no reason to pretend that one allocation method automatically represents the single “true” cost of every design. The important point is to define your method clearly and apply it consistently if your business needs design-level analysis.
For the simpler buying decision covered in this guide, the primary metric remains the order-level effective cost per usable transfer.
How Unused Space Affects the Calculation
It is important not to make assumptions about how a supplier's actual pricing system assigns value to unused physical space. You can still evaluate unused capacity from your own order-economics perspective without claiming anything about how the supplier calculates its prices.
If two hypothetical order scenarios have the same comparable total cost but one produces fewer usable transfers, the scenario with fewer usable transfers will have a higher calculated cost per usable transfer.
For example, getting 60 usable transfers for a given hypothetical total and getting 45 usable transfers for the same total will produce different unit-cost results.
This is one way that unproductive space or unnecessary artwork can become visible in your analysis. You do not need to turn the exercise into a gang sheet layout optimization project. The relevant issue is simply whether the available sheet is producing transfers that contribute to your actual production plan.
The same logic applies to unnecessary duplicates. A transfer should not be counted as economically useful just because it physically appears on the sheet. If you do not expect to use it, including it in the denominator can make the average unit cost look artificially attractive.
Recalculate When Quantity Changes
Do not carry an old cost-per-transfer figure into a new order after the quantity changes. Recalculate using the new comparable total and the new usable transfer count.
For example, suppose a hypothetical first order costs $72 and produces 48 usable transfers. The average is $1.50 per usable transfer.
Now assume a different order scenario has a comparable total of $120 and produces 96 usable transfers.
$120 ÷ 96 = $1.25 average cost per usable transfer.
This example does not imply that Custom Print AZ applies a particular quantity discount or that larger orders will always produce a lower unit cost. It only demonstrates how to recalculate when the order inputs change.
Even if a larger quantity produces a lower calculated unit cost in a particular scenario, the additional transfers still need to serve a real production need. A lower mathematical average is less valuable if a significant share of the extra transfers will remain unused.
Use the Same Rules When Comparing Two Orders
A cost-per-transfer comparison is most useful when both scenarios follow the same rules. A simple process is:
- Define the comparable total cost for each scenario.
- Count the transfers you realistically expect to use.
- Exclude outdated, accidental, or unnecessary transfers from the usable count.
- Divide the comparable cost by the usable transfer count.
- If the sheet contains mixed sizes, treat the result as an order-level blended average.
- Do not assume that blended average represents the exact individual cost of every design.
- Recalculate whenever the quantity or artwork mix changes.
- Evaluate the result against the quantity you actually need, not just the lowest calculated unit cost.
This framework is designed to compare your own order scenarios. It is not a supplier-price comparison model, a “cheapest gang sheet” ranking, or a method for dividing costs between several customers or production jobs.
Choose an Order Route That Matches Your File
Once you understand the unit economics, the next step may depend on how your artwork is prepared.
If you have multiple individual artwork files but have not yet assembled them into one completed sheet, the DTF Gang Sheet Builder provides a route for arranging multiple graphics into a gang sheet.
If you already have a completed, print-ready gang sheet file, the Upload Gang Sheet route is designed for submitting an already assembled sheet.
The right route should not be chosen solely from the cost-per-transfer formula. File readiness and the workflow required before production are separate parts of the ordering decision.
Common Cost-Per-Transfer Mistakes
- Comparing only total prices: Two orders with different usable transfer counts are not fully described by their total prices alone.
- Counting every graphic as usable: Outdated, unnecessary, or accidental transfers can make the calculated average look lower than the practical result.
- Treating blended cost as exact design-level cost: A mixed-size average does not prove that a small logo and a large back print have the same individual cost.
- Reusing an old unit cost after quantity changes: New totals and new usable counts require a new calculation.
- Assuming the lowest average is automatically the best buy: Extra transfers have limited economic value if you do not expect to use them.
The Most Useful Comparison Starts With What You Will Actually Use
When evaluating DTF gang sheet pricing, “How much does this sheet cost?” is only the first question. The more useful follow-up is, “How many of the transfers in this order will I actually use?”
Dividing a consistent comparable cost by the usable transfer count gives you a practical unit metric for comparing order scenarios. When a sheet contains mixed-size artwork, treat that result as a blended order-level average rather than an exact design-by-design cost. When quantities change, run the calculation again instead of carrying the old average forward.
This approach keeps the buying decision focused on your own production economics. Instead of judging a gang sheet only by its total price, you can evaluate how effectively the order converts your spending into transfers you expect to use.


